

Compliments of
 Alan Van Zee
President | NMLS #: 297154
Hawaii Mortgage Company, Inc.
Company NMLS #: 232582
Alan Van Zee is one of the top producing Mortgage Originators in the state, originating over $2,000,000,000 to date. He has written and published this weekly newsletter for the past 18 years. It is the most widely read mortgage, real estate, and finance publication in Hawaii.
Hawaii Mortgage Company, now in our 26th year of providing mortgages to the people of Hawaii, is proud to have a complaint-free history. We make sure our clients are happy!
News and Insight
For the Weekend of December 13th, 2025
Hawaii’s Most Read Mortgage, Real Estate, and Finance Publication for 18 Years
Volume 18 – Issue 13
How’s Real Estate Really Looking?
It’s amazing that just when interest rates start to find their way back to realistic levels I am seeing so much in the news and social media about the coming disaster in real estate. Are the doomsayers right? Would it be foolish to buy now? It all depends on where and what you’re looking for. Join me today as we look at the country as a whole and then investigate our little neck of the woods here in Hawaii.
Nationally:
When throwing all the data from every state into consideration, 2026 looks to be a good year for real estate. Fannie Mae, along with research firm called Pulsenomics, just released their home appreciation forecast for 2026. They project the median home appreciation for 2026 will be 2.4%. For those that missed the class on median, median is the point where half of the set of numbers falls below the median, while the other equal amount is above. Median is not the average; it is the direct middle.
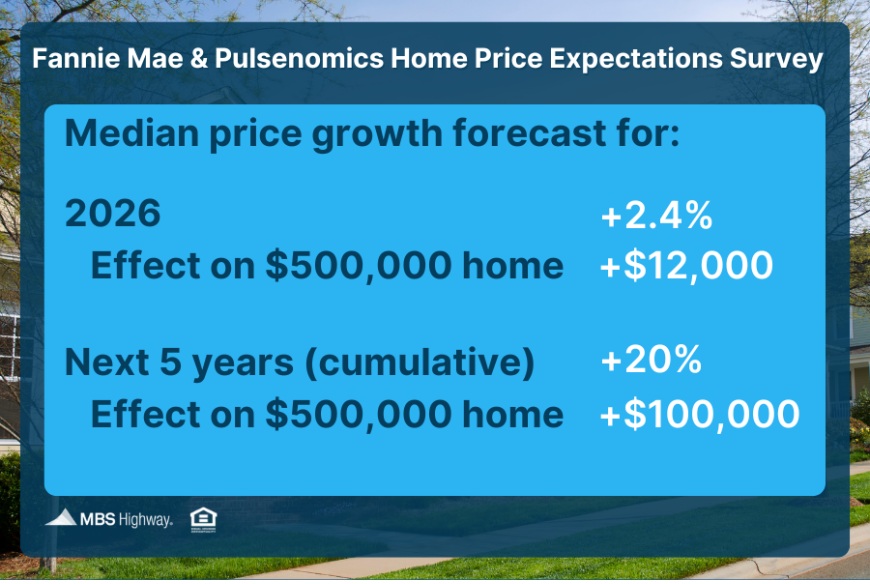
That’s great news for those that already own. If your home is worth $500,000, a 2.4% increase in value will earn you $12,000 in new equity. Better yet, their research predicted a cumulative gain of 20% over the next 5 years. That’s a gain of $100,000 over that 5-year period. If you’re scratching your head and wondering how 2.4% turns into 20%, keep in mind that each year your home will increase in value based on its new stepped-up value and increase based on that value – not the original $500,000. After year one, $512,000. After year two, $524,288, and so on. It’s the wonderful world of compounding – earning on what you’ve already earned.
While the above seems really rosy, we all know that some parts of the country are doing better with real estate than others.
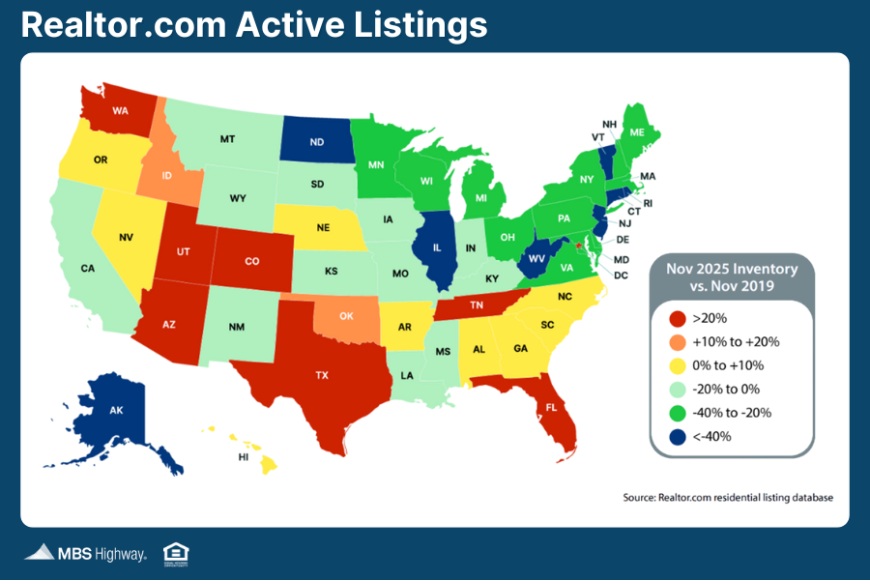
Above is a chart comparing inventory in each state in November 2025 versus the inventory they had in 2019 - just before COVID hit. As a whole, the country today has 6% less listings than at the same time in 2019. But the rainbow of colors in the chart demonstrates that real estate in some states is much healthier than others.
Following the rules of supply and demand, and correlating with current sales data, areas with higher listings reported weakness and lower prices. Areas with lower listings report a higher prices.
So where are the good deals right now? States colored red in the chart report a buyers’ market with price reductions, offers accepting below listing, and homes on the market for longer periods than what we’ve seen recently. Those states include Washington, Utah, Colorado, Arizona, Texas, Tennessee, Florida, and the District of Columbia.
In contrast, states such as Alaska, North Dakota, Illinois, West Virgina, New Jersey, Connecticut, Rhode Island, and Vermont are reporting significantly less inventory and higher home prices.
Hawaii:
As with the big US map showing variations from state to state and region to region, Hawaii also is showing mixed results depending on which area within the state you are looking at. The data I’m pulling from shows October year-over-year data, plus year-to-date data. Because some counties have a smaller number of sales, the year-over-year data tends to show greater fluctuation. For our analysis, we used year-to-date data.
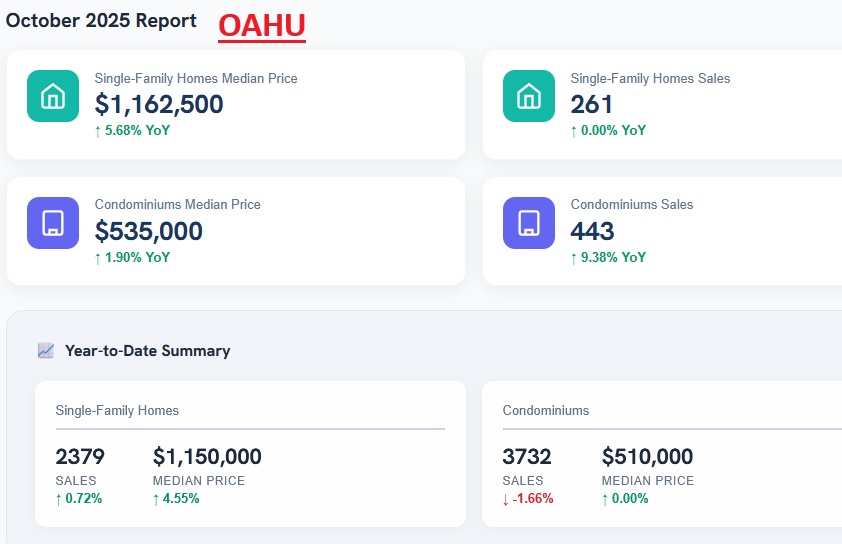
Oahu has the healthiest market. Home and condo prices are up. Home sales are slightly higher, while condo sales are slightly lower.
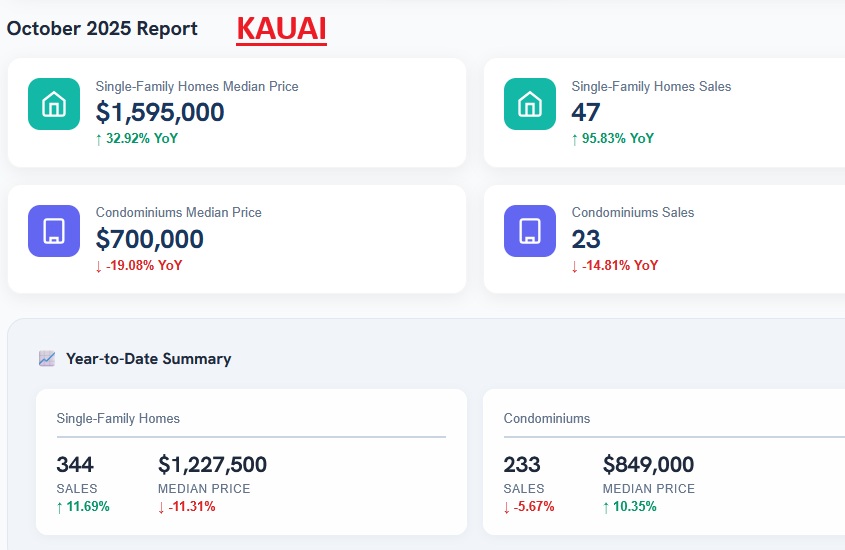
Kauai’s data shows how the reporting period and limited sales can change the data significantly. While home prices shot up dramatically in October 2025 versus 2024, the year-to-date data shows the opposite with drop in home prices. The condo market is a mixed bag with year-to-date prices up, but overall sales down.
Hawaii Island shouldn’t be grouped into one lump of data. East and West Hawaii are as different as Oahu is to Molokai. But as reported, the island as a whole saw home prices and volume slightly up, while condo prices and volume are down – all based on year-to-date data.
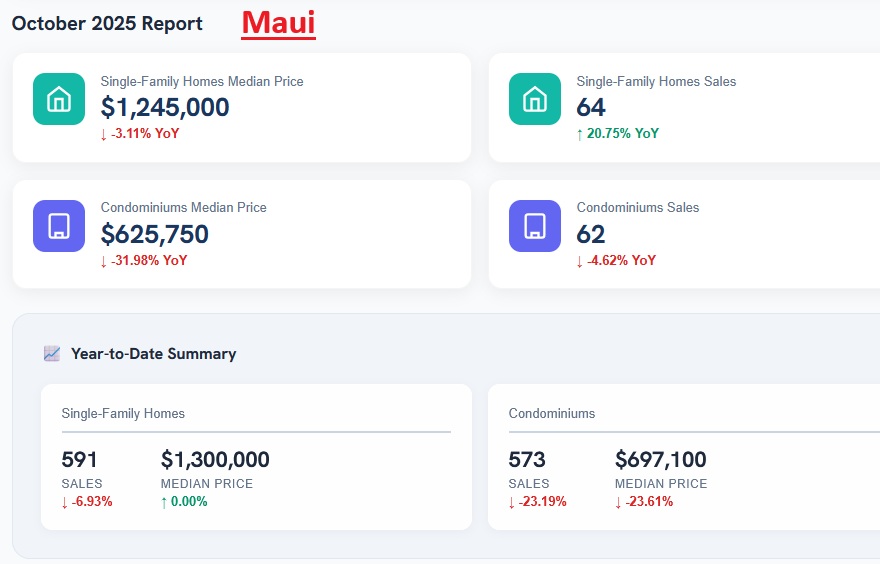
Maui is listed last because Maui is in last place with its data. Maui home prices are trying to stay positive despite less sales. But the condo market is a disaster. Blame it all on Bill 9 making its way through the county government.
The most recent data published by the Hawaii Association of Realtors shows the following for each island:
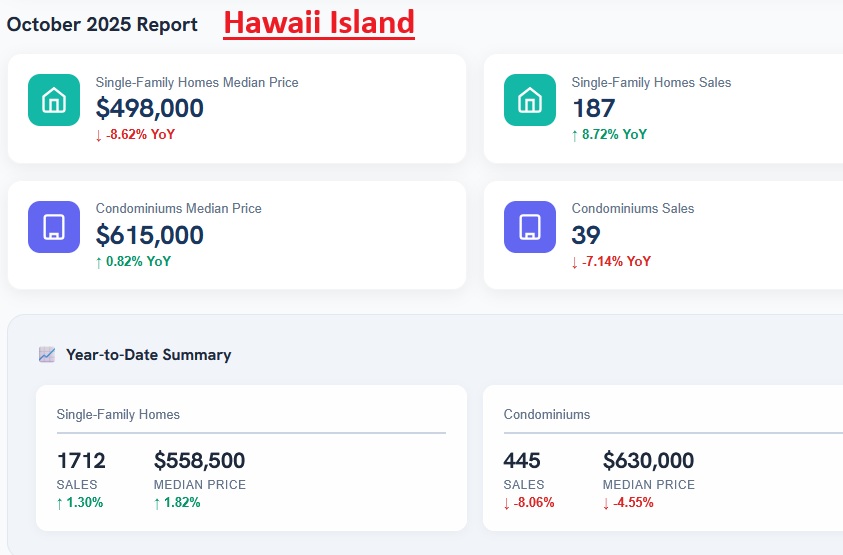
As with the data seen on the mainland, as mortgage rates continue to drop, unless we see the number of properties listed for sale rise, home prices will remain elevated. Condos are definitely taking a hit with so many buildings hitting up owners with special assessments and large increases in monthly HOA fees.
And now the week’s economic news…….
Fed Eases
With little major economic news, investors were focused on the Fed meeting this week. The message from the Fed was essentially in line with expectations, causing little reaction. Mortgage rates ended the week slightly higher.
Heading into the Fed meeting on Wednesday, investors had anticipated another rate cut with a message indicating that this might be the last one for a while. As a result, the 25 basis point cut in the federal funds rate to a range of 3.50 to 3.75% surprised no one. Even with dissent from three officials, the most since September 2019, there was little reaction, as it had been well established that there was an unusually high degree of disagreement on the committee. The basic question remains whether to place more weight on stubbornly high inflation or on a weakening labor market. The dot plot projections from officials indicated that there will be just one more 25 basis point rate cut next year and one additional reduction in 2027, similar to their last set of forecasts three months ago. During the press conference following the meeting, Chair Powell said that the Fed is now "well positioned to wait to see how the economy evolves." Perhaps the biggest surprise was that the Fed will resume purchasing Treasuries this month, sooner than expected.
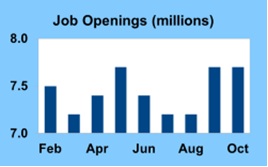 The latest JOLTS (job openings and labor turnover rates) report, covering the month of October, revealed mixed results. At the end of October, there were 7.7 million job openings, well above the consensus forecast of 7.2 million and the most in five months. Sectors with the most vacancies included trade, transportation, and utilities. A larger number of openings suggest that companies face more pressure to raise wages to hire enough workers, a sign of strength in the labor market.
By contrast, the number of layoffs rose to the highest level since early 2023. In addition, the quits rate, which measures the percentage of people voluntarily leaving their jobs, fell to the lowest level since May 2020. Generally, workers are less likely to quit when they are less confident in their ability to find a better opportunity.
It was a good week for mortgage applications overall, especially for refinancings, according to the Mortgage Bankers Association (MBA). Applications to refinance rose 14% from last week and were a massive 88% higher than one year ago. Purchase applications fell slightly from the prior week but still were up 19% from last year at this time. Buyers seeking lower rates increasingly turned to the FHA. There was a 24% gain in FHA refinances and a 5% rise in FHA purchase applications this week.
Next Week
Looking ahead, investors will continue to monitor comments from Fed officials for hints about monetary policy next year. With the end of the shutdown, the schedule for the release of delayed government economic reports continues to be gradually updated. Tuesday will be the big day next week with the key Employment report, Retail Sales, Housing Starts, and Import Prices scheduled to be released. The Employment report reveals figures on the number of jobs, the unemployment rate, and wage inflation which are always closely watched. The Consumer Price Index (CPI), a widely followed monthly inflation indicator that looks at the price changes for a broad range of goods and services, will come out on Thursday. Existing Home Sales will be released on Friday.
Until next week….

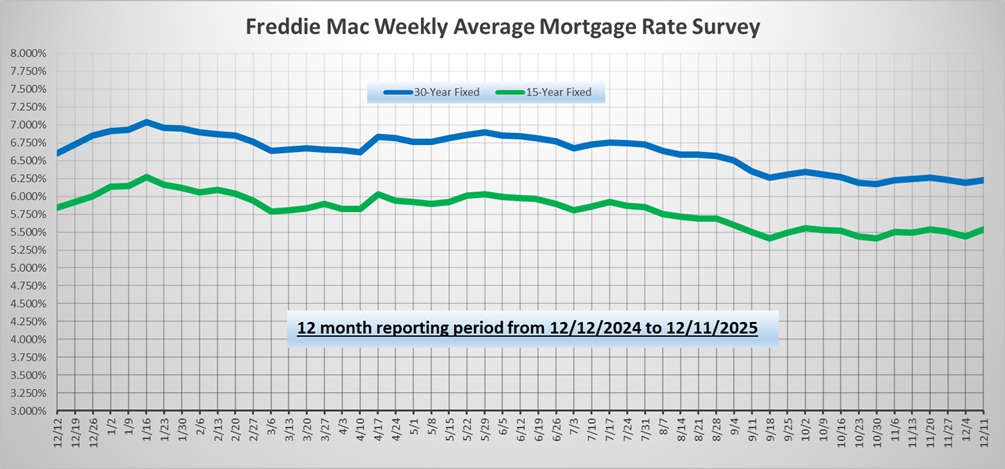
*** Please note that Freddie Mac publishes their weekly rate report on Wednesday mornings from data received Monday and Tuesday.
The graph above is intended to shown rate trends, and not “today’s current rate”. ***
Reviews From Our Past Clients
With every client, we promise to provide you with a comprehensive analysis of your mortgage needs, the best service possible, and the best rates we can find. We make it our mission to have every transaction close with our clients happy with the service we provided. Browse through the hundreds of reviews we’ve received from our clients posted on both Google and Zillow.com, and read what they thought of their experience using Hawaii Mortgage Company.
Google Link:
Hawaii Mortgage Company Review on Google.com
Zillow.com Link:
Hawaii Mortgage Company Reviews on Zillow.com
Our Rate Quote System is Available to You
Our automated rate quoting system is live. Now you can check rates and try different scenarios 24-hours a day. Remember, it’s just a computer. For non-standard rate quotes, such as construction, vacant land, and other specialty programs, you’ll still need to give a call.
Here’s the link: https://www.hawaiimortgage.net/todays-rates/

Do you think all lenders are the same?
There is a difference when you use Hawaii Mortgage Company for your financing. Here’s a short video telling you why:

Broker vs. Banker?
Click the link below to get a quick lesson on why working with a Mortgage Broker will benefit you on your next transaction.


